Background
The previous post tool a look at the API Journey – Client Side, to focus on some technical behaviors OAuth clients typically implement. This post dives deep into ensuring the most useful API logging results.
Logging Frameworks
Most online documents on API logging describe a widely used development approach, with the following generic capabilities. These behaviors are typically provided by a logging framework:
- Enable a logger per class
- Enable logging levels, such as DEBUG, INFO, WARN and ERROR
- Output log data to various locations via appenders
- Enable logging behavior to be changed via configuration
Results can be useful for local development, with a single user and a low volume of API requests. As we shall see however, this often leaves a lot to be desired for production systems.
Common Logging Problems
These are some common problems with API logs. To avoid them, start with your requirements rather than being led by the technology:
| Problem Area | Description |
|---|---|
| Difficult to Query | Logger per class output typically uses free text and as a result it only supports text find operations |
| Does not Scale | Under load it is difficult to understand which log entries are related, or to answer simple questions such as how many errors of a particular type there have been today |
| Not Configurable | In some setups it can be impossible to get stakeholders to change the production log level when there is a problem, for fear they will make things worse |
Technical Support Logging Requirements
Start by defining how you want a logging solution to work. This blog will use the following requirements:
| Requirement | Notes |
|---|---|
| Logs are Centralized | Log users go to a single known location to find technical support data for all API instances. |
| Logs are Structured | Logs contain data we want to query by, and each log entry can consist of both known and unknown fields. |
| Logs are Easy to Use | Any semi-technical person can issue basic queries against the log data, with a small learning curve. |
| Logs are Lightweight | Logging avoids redundant noise, so that they are readable and do not impact performance. |
| Logs are Secure | Logs do not include confidential data, such as emails or request bodies. As a result it should be possible to grant engineers access to production logs. |
| Logging is Always On | Incidents are always in the past and changing the log level after the event is too late. |
| Logging is the same Everywhere | Logging works the same on a development computer as in production. |
The primary goal of logging is a system that is easy for the following people to use. It must be able to deal with busy production systems, with hundreds of concurrent users, or a million API calls per day.
| Role | Usage |
|---|---|
| Developer | Looks at logs while coding |
| Tester | Looks at logs during various types of testing |
| DevOps | Looks at production logs to investigate incidents |
Solution Overview
This blog’s final APIs do immediate logging to a text file, which is a fast operation. In some setups, such as Kubernetes, the platform will create these files for us, by redirecting stdout. A Log Shipper then reads the text files and sends logs to a data store from where logs can be queried.
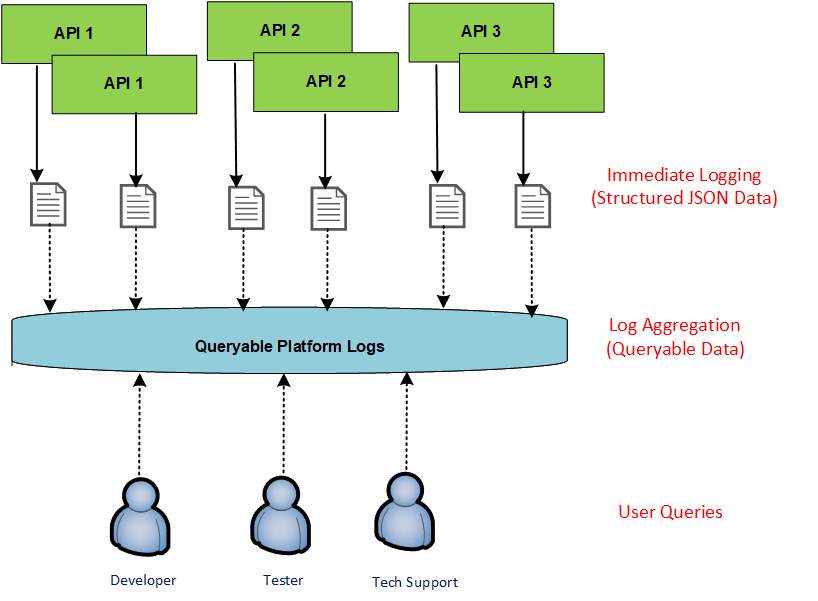
Log aggregation is very standard these days, and this blog uses the free open source Elastic Stack, deployed using containers. The essential part of the solution is for API logs to output useful data. Generic technical logging, including agents deployed to API servers, is always sub-optimal.
Multiple Logger Types
Frameworks use loggers to represent a category of output data. In this blog I will structure API code to use the following loggers, and only aggregate the first of these:
| Data Type | Output |
|---|---|
| Request Log | A production logger that outputs a single JSON object per API request and is easy to query |
| Logger per Class | Development loggers that output free text that can be useful for developers, but is difficult to query |
In more complex APIs, the logger per class data at an INFO level may also be useful in production. In this case an alternative approach is to aggregate both types of log data, but ensure that queries can join them using a Request ID.
Production Logs
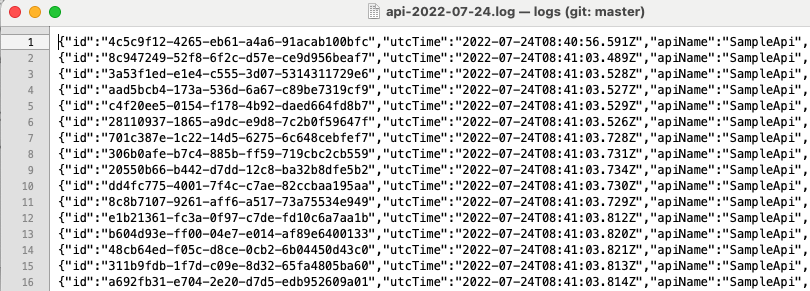
An example log entry is shown below, with fields similar to a Web Server HTTP Request Log Entry. The fields it contains are designed for log users to query by, rather than being purely HTTP related.
{
  "id": "c4939e2c-9f71-4f4b-bbca-dda287b48385",
  "utcTime": "2022-07-24T08:41:05.069Z",
  "apiName": "SampleApi",
  "operationName": "getCompanyTransactions",
  "hostName": "MACSTATION.local",
  "method": "GET",
  "path": "/investments/companies/2/transactions",
  "resourceId": "2",
  "clientApplicationName": "LoadTest",
  "userId": "a6b404b1-98af-41a2-8e7f-e4061dc0bf86",
  "statusCode": 200,
  "millisecondsTaken": 7,
  "millisecondsThreshold": 500,
  "correlationId": "3e4ac756-11c7-e60f-c564-ad4f203d5742",
  "sessionId": "a601559a-0c90-c899-8099-8a9f63a30be8"
}
Production Log Schema
This blog will use a schema with the following top level fields. Users of the logging system will be able to issue queries based on any of these:
| Field | Description |
|---|---|
| ID | A globally unique identifier for the log entry |
| UTC Time | The time when the API code received the request |
| API Name | The name of the API within the platform |
| Operation Name | The name of the operation within the API |
| Host Name | The name of the server that hosts this API instance |
| HTTP Method | Whether a GET, POST etc |
| Path | The URL path and query string |
| Resource ID | The REST URL runtime path segments that identify the resource |
| Client Application Name | A readable value for the application that called the API |
| User ID | The subject claim from the OAuth access token |
| Status Code | The response status code |
| Milliseconds Taken | The number of milliseconds that the API code took to execute |
| Milliseconds Threshold | The performance threshold beyond which the API operation is considered slow |
| Error Code | When an error occurs, this contains a text code to identify the cause of the error |
| Error ID | When an API 500 error occurs, this contains a generated number to track the exact error occurrence |
| Correlation ID | An identifier either supplied via a caller header or generated by the API otherwise |
| Session ID | Used to partition multiple related calls to the API together, such as those for a UI session or load test |
In addition, these child objects can be optionally logged, but not queried directly. They can be retrieved by getting documents, using the top level fields as queries.
| Field | Description |
|---|---|
| Performance | Provides instrumentation on expensive subtasks to help understand where time is being spent |
| Error | When the API returns a 400 or 500 response, this contains the error returned to the client, along with context and exception details where applicable |
| Info | Additional arbitrary data can be added here, though it should be used sparingly |
Users and Privacy
The User ID requires a special mention, since these days you must not record personally identifiable information such as names and emails in logs. I use an anonymous identifier for the OAuth subject claim, and log that as a stable value.
You also need to avoid inadvertent user tracking. The logs are used to support a set of related apps and the User ID should only ever be available to people operating in this context. In some setups it may be safer to omit User IDs from logs.
API Logging Configuration
This blog’s final APIs are written in Node.js, .NET and Java and each of them defines its logging in the API configuration file. Production logs always use JSON output, to either the console or a file, and pretty printing is configured on a development computer.
{
    "apiName": "SampleApi",
    "production": {
        "level": "info",
        "performanceThresholdMilliseconds": 500,
        "transports": [
            {
                "type": "console",
                "prettyPrint": true
            },
            {
                "type": "file",
                "filePrefix": "api",
                "dirname": "./logs",
                "maxSize": "10m",
                "maxFiles": "7d"
            }
        ]
    },
    "development": {
        "level": "info",
        "overrideLevels": {
            "ClaimsCache": "info"
        },
        "transports": [
            {
                "type": "file",
                "filePrefix": "trace",
                "dirname": "./logs",
                "maxSize": "10m",
                "maxFiles": "7d"
            }
        ]
    }
},
In your own APIs it may make sense to instead use the built-in logging configuration, such as that provided by log4j2, for best flexibility. In this blog I avoided doing so since I wanted the logging configuration to look the same for all three API technologies.
By default , this blog’s APIs output production JSON logs at all stages of the pipeline, including development computers. When required, developers can temporarily change to a logger per class configuration.
Logging Framework Customization
Logging frameworks typically implement JSON logging by first adding their own fields, then encoding the JSON payload into a ‘message‘ field. This blog instead uses pure JSON, for best readability on development computers.
Later, in the API implementations, there is quite a bit of plumbing code in order to enable my desired inputs and output. It can be worth the effort though, to enable the best readability for users of logs.
JSON Output
In API development configurations, multi-line JSON is written to stdout by default. When log aggregation is used, log shipper components require immediate output to instead be bare JSON, on a single line.
To enable log aggregation from a development computer, log files are used. In container based setups you will also need to use log files if you aggregate more than one type of log data.
Logger per Class Output
To enable development output, the following type of configuration can be used. This disables JSON request logging and uses a debug level for the logger for the ClaimsCache class:
{
    "apiName": "SampleApi",
    "production": {
        "level": "info",
        "performanceThresholdMilliseconds": 500,
        "transports": [
            {
                "type": "file",
                "filePrefix": "api",
                "dirname": "./logs",
                "maxSize": "10m",
                "maxFiles": "7d"
            }
        ]
    },
    "development": {
        "level": "info",
        "overrideLevels": {
            "ClaimsCache": "debug"
        },
        "transports": [
            {
                "type": "console",
                "prettyPrint": true
            }
        ]
    }
}
The API code can then use the following type of ‘logger per class‘ logging:
const traceLogger = loggerFactory.getDevelopmentLogger(ClaimsCache.name);
traceLogger.debug(`Token to be cached will expire in ${secondsToCache} seconds (hash: ${accessTokenHash})`);
The request logs are then written only to a file and the console shows the logging you are interested in.
debug: 2022-07-24T09:31:09.219Z : ClaimsCache : Token to be cached will expire in 1656996443945 seconds (hash: 4185d7218f55d0a14314ee473c64f0a01b66b567f601d32d3b070dd654532da7)
debug: 2022-07-24T09:31:09.219Z : ClaimsCache : Adding token to claims cache for 1800 seconds (hash: 4185d7218f55d0a14314ee473c64f0a01b66b567f601d32d3b070dd654532da7)
debug: 2022-07-24T09:31:09.222Z : ClaimsCache : Token to be cached will expire in 1656996443944 seconds (hash: 46a5f14270fbff05d31310cf49bb1243076dec4f3d51fab562af7640dae2cd24)
debug: 2022-07-24T09:31:09.222Z : ClaimsCache : Adding token to claims cache for 1800 seconds (hash: 46a5f14270fbff05d31310cf49bb1243076dec4f3d51fab562af7640dae2cd24)
debug: 2022-07-24T09:31:09.223Z : ClaimsCache : Token to be cached will expire in 1656996443943 seconds (hash: 9fa995f769351cbccd8cd67b41e2a74636e8fb7db9c1cbf7702db29f5c231053)
debug: 2022-07-24T09:31:09.223Z : ClaimsCache : Adding token to claims cache for 1800 seconds (hash: 9fa995f769351cbccd8cd67b41e2a74636e8fb7db9c1cbf7702db29f5c231053)
debug: 2022-07-24T09:31:09.296Z : ClaimsCache : Found existing token in claims cache (hash: db090981096137579adba5a032aa386f443d78a31b5d755ba5a482fc29dd4fd1)
debug: 2022-07-24T09:31:09.297Z : ClaimsCache : Found existing token in claims cache (hash: 9fa995f769351cbccd8cd67b41e2a74636e8fb7db9c1cbf7702db29f5c231053)
debug: 2022-07-24T09:31:09.298Z : ClaimsCache : Found existing token in claims cache (hash: 46a5f14270fbff05d31310cf49bb1243076dec4f3d51fab562af7640dae2cd24)
debug: 2022-07-24T09:31:09.298Z : ClaimsCache : Found existing token in claims cache (hash: 84bae745760578309cfeea9f2e7cdae73aceea9b0565b4bef832875fd74d6150)
debug: 2022-07-24T09:31:09.300Z : ClaimsCache : Found existing token in claims cache (hash: 4185d7218f55d0a14314ee473c64f0a01b66b567f601d32d3b070dd654532da7)
Error Logs
When API requests return an HTTP 400 related status, the error returned to the client is logged, along with additional context. The code throws an exception, but no call stack is logged, since nothing has failed on the server:
{
  "id": "7af62b06-8c04-41b0-c428-de332436d52a",
  "utcTime": "2022-07-24T10:27:33.468Z",
  "apiName": "SampleApi",
  "operationName": "getCompanyTransactions",
  "hostName": "MACSTATION.local",
  "method": "GET",
  "path": "/investments/companies/2/transactions",
  "resourceId": "2",
  "clientApplicationName": "FinalSPA",
  "statusCode": 401,
  "errorCode": "invalid_token",
  "millisecondsTaken": 2,
  "millisecondsThreshold": 500,
  "correlationId": "15b030a2-c67d-01ae-7c3f-237b9a70dbba",
  "sessionId": "77136323-ec8c-dce2-147a-bc52f34cb7cd",
  "errorData": {
    "statusCode": 401,
    "clientError": {
      "code": "invalid_token",
      "message": "Missing, invalid or expired access token"
    },
    "context": "JWT verification failed : signature verification failed"
  }
}
When API requests return an HTTP 500 related status, the error logged includes both the client and service errors, including the call stack. This information will typically be needed in order to resolve the problem:
{
  "id": "b36701c9-ddf2-d7da-df48-4dfcc918009b",
  "utcTime": "2022-07-24T10:28:00.435Z",
  "apiName": "SampleApi",
  "operationName": "getCompanyTransactions",
  "hostName": "MACSTATION.local",
  "method": "GET",
  "path": "/investments/companies/2/transactions",
  "resourceId": "2",
  "clientApplicationName": "FinalSPA",
  "userId": "a6b404b1-98af-41a2-8e7f-e4061dc0bf86",
  "statusCode": 500,
  "errorCode": "exception_simulation",
  "errorId": 79072,
  "millisecondsTaken": 9,
  "millisecondsThreshold": 500,
  "correlationId": "5f1f1bcb-79c4-00ee-a1fe-be5e4262eb75",
  "sessionId": "77136323-ec8c-dce2-147a-bc52f34cb7cd",
  "errorData": {
    "statusCode": 500,
    "clientError": {
      "code": "exception_simulation",
      "message": "An unexpected exception occurred in the API",
      "id": 79072,
      "area": "SampleApi",
      "utcTime": "2022-07-24T10:28:00.438Z"
    },
    "serviceError": {
      "details": "",
      "stack": [
        "Error: An unexpected exception occurred in the API",
        "at Function.createServerError (/Users/gary/dev/oauth.apisample.nodejs/src/plumbing/errors/errorFactory.ts:16:16)",
        "at CustomHeaderMiddleware.processHeaders (/Users/gary/dev/oauth.apisample.nodejs/src/plumbing/middleware/customHeaderMiddleware.ts:27:36)",
        "at Layer.handle [as handle_request] (/Users/gary/dev/oauth.apisample.nodejs/node_modules/express/lib/router/layer.js:95:5)",
        "at trim_prefix (/Users/gary/dev/oauth.apisample.nodejs/node_modules/express/lib/router/index.js:328:13)",
        "at /Users/gary/dev/oauth.apisample.nodejs/node_modules/express/lib/router/index.js:286:9",
        "at param (/Users/gary/dev/oauth.apisample.nodejs/node_modules/express/lib/router/index.js:365:14)",
        "at param (/Users/gary/dev/oauth.apisample.nodejs/node_modules/express/lib/router/index.js:376:14)",
        "at Function.process_params (/Users/gary/dev/oauth.apisample.nodejs/node_modules/express/lib/router/index.js:421:3)",
        "at next (/Users/gary/dev/oauth.apisample.nodejs/node_modules/express/lib/router/index.js:280:10)",
        "at ClaimsCachingAuthorizer.authorizeRequestAndGetClaims (/Users/gary/dev/oauth.apisample.nodejs/src/plumbing/security/baseAuthorizer.ts:62:13)"
      ]
    }
  }
}
Performance Instrumentation
In places the API code contains statements such as this, to measure the performance of a particular routine, which may also include time for an async await call:
public async getUserInfo(accessToken: string): Promise<UserInfoClaims> {

    return using(this._logEntry.createPerformanceBreakdown('userInfoLookup'), async () => {

        try {

            const response = await axios.request(options as AxiosRequestConfig);
            return ClaimsReader.userInfoClaims(response.data);

        } catch (e: any) {

            throw ErrorUtils.fromUserInfoError(e, this._configuration.userInfoEndpoint);
        }
    });
}
To see this output, change the logging configuration to use a zero performance threshold:
{
    "apiName": "SampleApi",
    "production": {
        "level": "info",
        "performanceThresholdMilliseconds": 0,
        ...
    }
}
The logging then contains performance instrumentation:
{
  "id": "baf31c4c-6bf3-5ba3-2863-169a088b4776",
  "utcTime": "2022-07-24T10:30:10.697Z",
  "apiName": "SampleApi",
  "operationName": "getCompanyList",
  "hostName": "MACSTATION.local",
  "method": "GET",
  "path": "/investments/companies",
  "clientApplicationName": "FinalSPA",
  "userId": "a6b404b1-98af-41a2-8e7f-e4061dc0bf86",
  "statusCode": 200,
  "millisecondsTaken": 383,
  "millisecondsThreshold": 0,
  "correlationId": "b4b1f41c-abcb-f99f-e8fd-0193ff7c2099",
  "sessionId": "77136323-ec8c-dce2-147a-bc52f34cb7cd",
  "performance": {
    "name": "total",
    "millisecondsTaken": 383,
    "children": [
      {
        "name": "validateToken",
        "millisecondsTaken": 84
      },
      {
        "name": "userInfoLookup",
        "millisecondsTaken": 292
      },
      {
        "name": "selectCompanyListData",
        "millisecondsTaken": 1
      }
    ]
  }
}
Each performance section also has a details field, which can be useful for storing additional information. For example, further code could be added to include sanitized SQL and parameters when there is a database error or SQL performance is beyond a threshold:
{
    "name": "selectCompanyTransactions",
    "detail": "select * from transactions where companyId=@p0; @p0=2"
    "millisecondsTaken": 2011
}
Arbitrary Data
The Info object can be used to handle other use cases. One option might be to temporarily log request input under particular error conditions. This might help to resolve a particularly tricky bug caused by input data, that can’t be reproduced in any other way.
Client Context
Whenever one of our Final UIs or an API Load Test makes API requests, the following three custom HTTP headers are also sent:
- A Correlation ID for the exact request
- A Session ID for all requests in the same session
- A Client Application Name to easily identify the client
This client context helps to satisfy query use cases for log users, including the ability to quickly access only logs for your own Session ID:
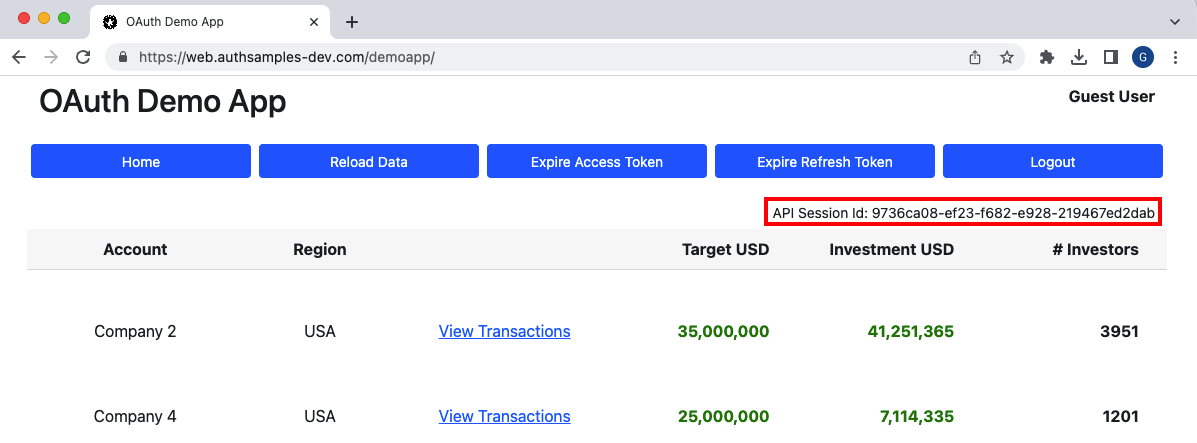
If our API was to call upstream APIs it would include the above context fields, so that each API includes these identifiers in its own log entry.
Request Logging Implementation
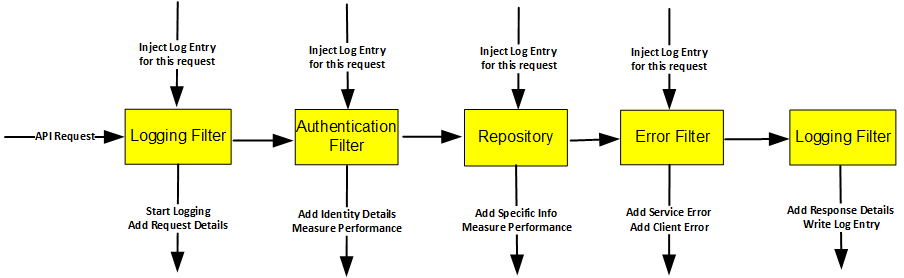
An implementation needs to populate a LogEntry object stored in memory during the lifetime of the API request, then output its data when the request ends. This is trickier to code than when using a logger per class:
- Identity details are best captured via an Authentication Filter
- HTTP Request details are best captured via Logging Filter
- Exception details are best captured via an Error Filter
- Business logic classes may sometimes need to contribute to logs
The LogEntry is a natural request scoped object, and it needs to be injected into a number of other classes. This log’s Final APIs will implement this in Node.js, C# and Java, while ensuring that it works correctly when switching threads after async await calls:
Non REST API Operations
APIs often also implement non REST operations, such as receiving an event message from a message broker, or running a scheduled job. Each of these represents a unit of work, similar to a REST API call.
If a Billing API subscribes to an event called OrderCreated and creates an invoice, that unit of work could log to the same schema, with similar coding techniques. I would write the following type of log entry, as a logical REST operation rather that a physical one, but with an expressive result:
{
  "id": "c4939e2c-9f71-4f4b-bbca-dda287b48385",
  "utcTime": "2022-07-24T08:41:05.069Z",
  "apiName": "SampleApi",
  "operationName": "OrderCreated",
  "hostName": "MACSTATION.local",
  "method": "POST",
  "path": "/invoices/777",
  "resourceId": "777",
  "clientApplicationName": "MessageBroker",
  "userId": "a6b404b1-98af-41a2-8e7f-e4061dc0bf86",
  "statusCode": 200,
  "millisecondsTaken": 7,
  "millisecondsThreshold": 500,
  "correlationId": "3e4ac756-11c7-e60f-c564-ad4f203d5742",
  "sessionId": "a601559a-0c90-c899-8099-8a9f63a30be8"
}
Although there is no physical HTTP request, assigning failures a status code is a widely understood way to convey a high level result to people. Logging client and service parts of an error also remains a good practice, in case an external recipient needs to be notified of failures.
Tracing Standardization
This blog’s API logging could be updated to output performance details as OpenTelemetry traces. The correlation ID in the log schema would then store the OpenTelemetry trace ID. Performance breakdowns would be recorded as spans in the standardized trace format.
Logs and traces are closely related, so should be queryable in the same observability system. The Elastic Stack provides this type of integration, though its ability to effectively slice and dice aggregated log data has by far the highest value.
Where Are We?
We have articulated how this blog’s logging would behave in a platform of APIs. Next we will describe this blog’s approach to handling errors and enabling fast problem resolution, both during and after development.
Next Steps
- The next post focuses on Error Handling and Supportability
- For a list of all blog posts see the Index Page