Background
Previously we ran some API Automated Tests, and next we will deploy a local Docker based Elasticsearch Log Aggregation system. This will enable logs to flow from APIs during development.
API Logging Output
At this point we have completed our API coding and the log data contains useful fields that are written to text files, one line per entry:
{"id":"f1c38406-6d1e-212f-ee8b-e100a4219b28","utcTime":"2022-07-15T17:34:28.631Z","apiName":"SampleApi","operationName":"getCompanyList","hostName":"MACSTATION.local","method":"GET","path":"/investments/companies","statusCode":401,"errorCode":"unauthorized","millisecondsTaken":10,"millisecondsThreshold":500,"correlationId":"b868385c-e8fa-9496-9d5b-492158e3d555","errorData":{"statusCode":401,"clientError":{"code":"unauthorized","message":"Missing, invalid or expired access token"},"context":"No access token was supplied in the bearer header"}}
{"id":"c997e4f0-e7a3-ed9c-253f-fd25110a4a33","utcTime":"2022-07-15T17:34:37.065Z","apiName":"SampleApi","operationName":"getCompanyTransactions","hostName":"MACSTATION.local","method":"GET","path":"/investments/companies/2/transactions","resourceId":"2","clientApplicationName":"LoadTest","userId":"a6b404b1-98af-41a2-8e7f-e4061dc0bf86","statusCode":200,"millisecondsTaken":124,"millisecondsThreshold":500,"correlationId":"bd845c50-8995-92eb-fb2f-bc81a4405fef","sessionId":"50f7bbae-04a2-8ba1-1cde-6a44916ab4aa"}
{"id":"8e41a54c-1d40-8269-c8f4-12b1bf54ad74","utcTime":"2022-07-15T17:34:37.046Z","apiName":"SampleApi","operationName":"getUserInfo","hostName":"MACSTATION.local","method":"GET","path":"/investments/userinfo","clientApplicationName":"LoadTest","userId":"a6b404b1-98af-41a2-8e7f-e4061dc0bf86","statusCode":200,"millisecondsTaken":162,"millisecondsThreshold":500,"correlationId":"5ec0eedf-0dcf-aa8d-f64c-1522e8a65a32","sessionId":"50f7bbae-04a2-8ba1-1cde-6a44916ab4aa"}
Of course these raw logs are not easy to read, and the next step is to import them into a Queryable Data Store. This will not require any coding, but we will need to understand how to configure open source logging tools.
Logging Technology Stack
We will provide an installation of Elastic Stack components, which provide a mature platform with some great features.

We will set up the following components to a basic level on a developer PC, then demonstrate rich and highly useful queries against our API log data.
| Component | Role |
|---|---|
| Elasticsearch | A big data store which provides rich query capabilities |
| Kibana | A UI which we can use for query related operations |
| Filebeat | A lightweight tool to ship JSON log files to Elastic Search |
Our API logging solution is not locked-in to Elasticsearch, and if we ever found a better option we could migrate to it without any API code changes.
Step 1: Download Elastic Resources
This blog provides some helper resources which can be downloaded with the following command:
git clone https://github.com/gary-archer/logaggregation.elasticsearchWe will run scripts from the docker-local folder to deploy a development setup for Elasticsearch with working API log aggregation:

Step 2: Configure DNS and SSL
First add the following logging domain name to your computer’s hosts file:
127.0.0.1 localhost logs.authsamples-dev.comNext run the following script to download a development SSL certificate for this domain name:
./deployment/docker-local/downloadcerts.shThen follow instructions to configure Browser SSL trust for the following root certificate, so that we can run the Kibana UI later:
./deployment/docker-local/certs/authsamples-dev.ca.pemStep 3: Understand Elasticsearch Deployment
Next we will run a Docker Compose deployment, that includes the main Elasticsearch system. The installation uses xpack security at a basic level, with SSL connections between components:
elasticsearch:
  image: docker.elastic.co/elasticsearch/elasticsearch:latest
  hostname: elasticsearch-internal.authsamples-dev.com
  ports:
    - 9200:9200
  volumes:
    - ./certs/authsamples-dev.ca.pem:/usr/share/elasticsearch/config/certs/authsamples-dev.ca.crt
    - ./certs/authsamples-dev.ssl.p12:/usr/share/elasticsearch/config/certs/authsamples-dev.ssl.p12
  environment:
    discovery.type: 'single-node'
    xpack.security.enabled: 'true'
    xpack.security.autoconfiguration.enabled: 'false'
    xpack.security.http.ssl.enabled: 'true'
    xpack.security.http.ssl.keystore.path: '/usr/share/elasticsearch/config/certs/authsamples-dev.ssl.p12'
    xpack.security.http.ssl.keystore.password: 'Password1'
    xpack.security.http.ssl.certificate_authorities: '/usr/share/elasticsearch/config/certs/authsamples-dev.ca.crt'
    ES_JAVA_OPTS: -Xmx4g
    ELASTIC_PASSWORD: '${ELASTIC_PASSWORD}'
Elasticsearch’s REST API will be contactable via both of these URLs, and in a hardened setup you would typically avoid exposing the external endpoint:
| URL | Description |
|---|---|
| https://logs.authsamples-dev.com:9200 | The external URL for connecting from the host computer |
| https://elasticsearch-internal.authsamples-dev.com:9200 | The internal URL used by Kibana and Filebeat inside the Docker network |
Step 4: Understand Kibana Deployment
The Kibana system will connect to Elasticsearch as the kibana_system user, and the deployment sets an initial password. Meanwhile we will login to the Kibana web UI using default admin credentials of elastic / Password1:
kibana:
  image: docker.elastic.co/kibana/kibana:latest
  hostname: kibana-internal.authsamples-dev.com
  ports:
    - 5601:5601
  volumes:
    - ./certs/authsamples-dev.ca.pem:/usr/share/kibana/config/certs/authsamples-dev.ca.crt
    - ./certs/authsamples-dev.ssl.p12:/usr/share/kibana/config/certs/authsamples-dev.ssl.p12
  environment:
    ELASTICSEARCH_HOSTS: 'https://elasticsearch-internal.authsamples-dev.com:9200'
    ELASTICSEARCH_USERNAME: '${KIBANA_SYSTEM_USER}'
    ELASTICSEARCH_PASSWORD: '${KIBANA_PASSWORD}'
    SERVER_PUBLICBASEURL: 'https://logs.authsamples-dev.com:5601'
    SERVER_SSL_ENABLED: 'true'
    SERVER_SSL_KEYSTORE_PATH: '/usr/share/kibana/config/certs/authsamples-dev.ssl.p12'
    SERVER_SSL_KEYSTORE_PASSWORD: 'Password1'
    ELASTICSEARCH_SSL_CERTIFICATEAUTHORITIES: '/usr/share/kibana/config/certs/authsamples-dev.ca.crt'
Once the installation has completed, Kibana will later be accessible using the following URL:
Step 5: Understand Filebeat Deployment
Filebeat is deployed with the following Docker settings, and the log folder for the final API is shared from the host computer to the Docker container:
filebeat:
  image: docker.elastic.co/beats/filebeat:latest
  hostname: filebeat-internal.authsamples-dev.com
  volumes:
    - ./filebeat.yml:/usr/share/filebeat/filebeat.yml
    - ./certs/authsamples-dev.ca.pem:/usr/share/filebeat/certs/authsamples-dev.ca.crt
    - ../../../oauth.apisample.nodejs/logs:/var/log/api
  environment:
    ELASTICSEARCH_USERNAME: '${ELASTIC_USER}'
    ELASTICSEARCH_PASSWORD: '${ELASTIC_PASSWORD}'
The main configuration is included in the filebeat.yml file, whose json settings tell Filebeat to read each bare line of the log file and ship it as an object, while maintaining the data type of each field:
filebeat.inputs:
- type: log
  paths:
  - /var/log/api/*.log
  json:
    keys_under_root: true
    add_error_key: false

output.elasticsearch:
  hosts: ['https://elasticsearch-internal.authsamples-dev.com:9200']
  username: elastic
  password: Password1
  index: "apilogs-%{+yyyy.MM.dd}"
  pipelines:
  - pipeline: apilogs
  ssl:
    certificate_authorities: ['/usr/share/filebeat/certs/authsamples-dev.ca.crt']

setup:
  ilm:
    enabled: false
  template:
    name: apilogs
    pattern: apilogs-*

processors:
- drop_fields:
    fields: ['agent', 'ecs', 'host', 'input', 'version']
Step 6: Generate Logs via an API and Client
To generate local API logs you need to run an API, and a client that calls the API to cause logs to be written. Components should be run in this type of folder layout, at the same level as the log aggregation repository:
~/dev/logaggregation.elasticsearch
~/dev/oauth.websample.final
~/dev/oauth.apisample.nodejs
I sometimes use log aggregation when developing this blog’s secured components, when I want to look more closely at API logs. In this case I run the Final Node.js API locally, with the Final SPA client.
| Client | Behaviour |
|---|---|
| API | The Final API post explains how to run a Local API Setup |
| SPA | The Final SPA post explains how to point to a Local API |
To run these components, ensure that you have added the following entries to the hosts file on your local computer. In this configuration, the SPA routes API requests via its local backend for frontend:
127.0.0.1 logs.authsamples-dev.com web.authsamples-dev.com api.authsamples-dev.com login.authsamples-dev.com
You can then run a setup, where you run the SPA client and then interactively query the API logs the UI’s session has generated:

Step 7: Deploy the Elastic Stack
Next run the following command to start the Docker deployment. It may take a few minutes for large Elastic Stack Docker containers to download, the first time the deployment is run:
./deployment/docker-local/deploy.shA number of actions are then triggered, as indicated by the console output:
Deploying the Elastic Stack ...
[+] Running 4/4
 ⠿ Network elasticstack_default            Created                                                                                                            0.1s
 ⠿ Container elasticstack-elasticsearch-1  Started                                                                                                            1.3s
 ⠿ Container elasticstack-filebeat-1       Started                                                                                                            1.2s
 ⠿ Container elasticstack-kibana-1         Started                                                                                                            1.3s
Waiting for Elasticsearch endpoints to become available ...
Registering the default Kibana user ...
Creating the Elasticsearch schema ...
Creating the Elasticsearch ingestion pipeline ...
Once the installation is complete, you can verify connectivity to the Elasticsearch REST API with the following HTTP request:
curl -k https://logs.authsamples-dev.com:9200 -u 'elastic:Password1'This results in Elasticsearch system information being returned:
{
  "name" : "elasticsearch-internal.authsamples-dev.com",
  "cluster_name" : "docker-cluster",
  "cluster_uuid" : "V58E_JA1TSizDU1jaFBJbA",
  "version" : {
    "number" : "8.7.0",
    "build_flavor" : "default",
    "build_type" : "docker",
    "build_hash" : "8b0b1f23fbebecc3c88e4464319dea8989f374fd",
    "build_date" : "2022-07-06T15:15:15.901688194Z",
    "build_snapshot" : false,
    "lucene_version" : "9.5.0",
    "minimum_wire_compatibility_version" : "7.17.0",
    "minimum_index_compatibility_version" : "7.0.0"
  },
  "tagline" : "You Know, for Search"
}
Later, when you are finished with testing, free up all Docker resources with the following command:
./deployment/docker-local/teardown.shStep 8. Access Log Query Tools
Next sign in to Kibana with credentials elastic / Password1. There are various tools for working with logs, though I consider the following URL to be the most important:
The Dev Tools allow you to access API log documents and fields without restriction, unlike many other logging solutions. Each API log entry will be available in a record of the following form:

Step 9: Understand the API Logs Index
Each log entry will be received as a JSON document within an apilogs index. Queries are typically made against top level fields. Meanwhile, JSON objects in logs, such as those used to represent errors, maintain their structure:
{
  "hostName": "MACSTATION.local",
  "apiName": "SampleApi",
  "utcTime": "2022-07-24T14:13:20.647Z",
  "millisecondsTaken": 7,
  "errorCode": "exception_simulation",
  "errorData": {
    "serviceError": {
      "stack": [
        "com.mycompany.sample.plumbing.errors.ErrorFactory.createServerError(ErrorFactory.java:20)",
        "com.mycompany.sample.plumbing.interceptors.CustomHeaderInterceptor.preHandle(CustomHeaderInterceptor.java:35)",
        "org.springframework.web.servlet.HandlerExecutionChain.applyPreHandle(HandlerExecutionChain.java:148)",
        "org.springframework.web.servlet.DispatcherServlet.doDispatch(DispatcherServlet.java:1062)"],
      "errorCode": "exception_simulation"
    },
    "clientError": {
      "area": "SampleApi",
      "code": "exception_simulation",
      "utcTime": "2022-07-16T08:06:00.268106Z",
      "id": 32802,
      "message": "An exception was simulated in the API"
    },
    "statusCode": 500
  },
  "path": "/investments/companies",
  "correlationId": "fc081b42-2be0-454e-bdf6-f5df444b7b50",
  "id": "14ca7188-a4cb-4df5-9bb7-5f829d97b338",
  "errorId": 32802,
  "clientApplicationName": "LoadTest",
  "method": "GET",
  "operationName": "getCompanyList",
  "sessionId": "9553ffcb-f295-41e5-8b6e-5f9e068c7e2f",
  "userId": "a6b404b1-98af-41a2-8e7f-e4061dc0bf86",
  "@timestamp": "2022-07-16T08:06:00.262Z",
  "millisecondsThreshold": 500,
  "statusCode": 500
}
The deployment script defines types for fields received within the apilogs index, to ensure that we can dictate data types, rather than Elasticsearch guessing them based on data received:
"index_patterns": ["apilogs*"],
"mappings":
{
  "properties":
  {
    "id":
    {
      "type": "keyword"
    },
    "utcTime":
    {
      "type": "date"
    },
    "apiName":
    {
      "type": "keyword"
    },
    "operationName":
    {
      "type": "keyword"
    },
    "hostName":
    {
      "type": "keyword"
    },
    "method":
    {
      "type": "keyword"
    },
    "path":
    {
      "type": "keyword"
    },
    "resourceId":
    {
      "type": "keyword"
    }
}
The Filebeat configuration ensures that there is a separate index per day. This makes it easy to remove old indexes containing log data after a desired time to live.
Step 10: Understand Log Ingestion
By default, Filebeat adds some fields to each log entry on the outbound side of processing, and these are removed in the drop_fields processor, since they are not useful for this blog. On the inbound side of processing, an ingestion pipeline is created to customise behaviour:
{
    "description": "Ingest Pipeline for API Logs",
    "processors": [
      {
        "drop": {
          "if" : "ctx.apiName == null"
        },
        "script": {
          "lang": "painless",
          "description": "Use a client side unique id to prevent duplicates",
          "source": "ctx._id = ctx.id"
        },
        "date" : {
          "field" : "utcTime",
          "formats" : ["ISO8601"]
        },
        "remove": {
          "field": ["log", "stream"],
          "ignore_missing": true
        }
      }
    ]
  }
These processors are summarised below:
| Processor | Behaviour |
|---|---|
| drop | Ignores any log events from foreign log files encountered, since our logs all have an apiName field. |
| script | Prevents Elasticsearch from generating a unique _id field and instead set it to the id field from API logs. This ensures that if Filebeat gets redeployed and logs reprocessed, there will be no duplicated log entries in the aggregated data. |
| data | Assigns the utcTime from logs to the mandatory @timestamp field, rather than using the time logs were received. |
| remove | This removes any other extra fields that Elasticsearch generates during inbound processing. |
Step 11. Query API Logs
The next post will show a number of people focused API technical support queries that you can issue, when you have API logs containing useful data. At a software company this would improve productivity.
Step 12: Troubleshoot Filebeat
It can also be useful to understand how to diagnose logs that do not ship correctly. To do so, first make a remote connection to the Filebeat container with the following commands:
export FILEBEAT_CONTAINER_ID=$(docker ps | grep filebeat | awk '{print $1}')
docker exec -it $FILEBEAT_CONTAINER_ID bash
Then view the /var/log folder, which points to the api folder on the host computer, which is mounted as a volume to the Docker container:
-rw-r--r-- 1 root     root       5609 Aug 25 19:43 alternatives.log
drwxr-xr-x 7 filebeat filebeat    224 Oct  7 18:07 api
drwxr-xr-x 1 root     root       4096 Aug 25 19:43 apt
-rw-r--r-- 1 root     root      58592 May 31 15:43 bootstrap.log
-rw-rw---- 1 root     utmp          0 May 31 15:43 btmp
-rw-r--r-- 1 root     root     184555 Aug 25 19:43 dpkg.log
-rw-r--r-- 1 root     root      32032 Aug 25 19:57 faillog
-rw-rw-r-- 1 root     utmp     292292 Aug 25 19:57 lastlog
-rw-rw-r-- 1 root     utmp          0 May 31 15:43 wtmp
You should see files whose sizes match those on the host. On macOS you may need to disable the ‘Use gRPC FUSE for file sharing‘ option for this to work as expected:
-rw-r--r-- 1 filebeat filebeat 26311 Oct  2 19:59 api-2022-10-02.log
-rw-r--r-- 1 filebeat filebeat  4657 Oct  3 20:23 api-2022-10-03.log
-rw-r--r-- 1 filebeat filebeat  2103 Oct  7 18:08 api-2022-10-07.log
-rw-r--r-- 1 filebeat filebeat   511 Oct  2 19:46 api.2022-10-02.0.log
Alternatively, view filebeat’s own logs to see details of any log shipping errors:
export FILEBEAT_CONTAINER_ID=$(docker ps | grep filebeat | awk '{print $1}')
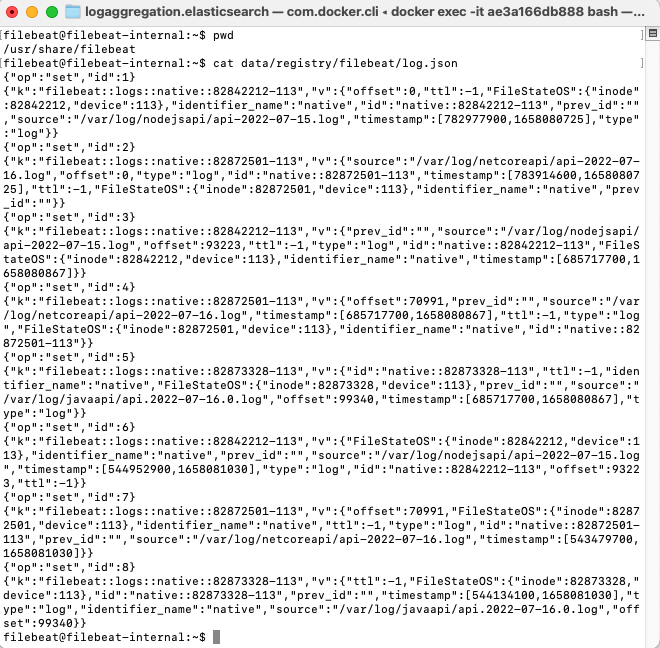
docker logs -f $FILEBEAT_CONTAINER_IDThe Filebeat documentation explains the component’s folder layout, and note that the data folder is used to track offsets in files being shipped:
Where Are We?
We have deployed the Elastic Stack on a local development computer, and the setup enables local API logs to be aggregated and then queried. In the next post we will drill into queries that work well for people.
Next Steps
- Next we will run some API Technical Support Analysis queries
- For a list of all blog posts see the Index Page